MONTHLY MARKET INTELLIGENCE
THE
TIDE
REPORT
Your briefing on Southern New Brunswick real estate trends, inspection insights from the field, and data that helps you advise your clients with confidence.
MARCH 2026 ── AGENT EDITION ── THEINSPECTORS.CA


The
This is a Paragraph. Click on "Edit Text" or double click on the text box to start editing the content and make sure to add any relevant details or information that you want to share with your visitors.
MARKET SNAPSHOT
THE NUMBERS LOOK STEADY.
THE DETAILS
TELL A DIFFERENT STORY.
The provincial headline is familiar: prices up, sales down, inventory creeping higher. But the February numbers have more to say when you look past the averages.
$330K
↑ 5.2% YoY
NB BENCHMARK PRICE
509
↓ 8.6% YoY
PRONVIAL SALES
5.1
↑ vs 4.6 Prior Year
MONTHS OF INVENTORY
-26.6%
Year Over Year
SAINT JOHN SALES
THE HEADLINE BEHIND THE HEADLINE
The $330,300 benchmark looks healthy on paper, but it masks a significant split by housing type. Single-family homes are up 5.6% year-over-year. Townhouses barely moved, gaining just 0.5%. And the apartment segment dropped 14.7%, the sharpest decline in the province's data.
For agents advising buyers, this distinction matters. A client looking at a single-family home in Quispamsis or Rothesay is entering a segment with real price momentum. A client considering an apartment-style property is entering a segment that has softened considerably and may offer more room to negotiate.
WHY DID SAINT JOHN DROP 26.6%?
Saint John posted the steepest year-over-year decline of any region in the province. Greater Moncton was also down (-10.3%), while Northern and Valley regions actually grew (+4.6%) and Fredericton edged up (+1.7%).
A few things are worth noting. First, February 2025 was a strong month in Saint John, so the comparison point is elevated. Second, the RE/MAX Saint John Housing Market Outlook notes that the average residential sale price in Saint John increased 7.3% across all property types between 2024 and 2025, from $340,097 to $366,989, so the longer trend is still positive. Third, new listings are running above seasonal norms. February saw 862 new residential listings provincially, the largest February total in five years.
What this tells you: the slowdown in Saint John is more about timing and comparison than a fundamental shift in direction. But pricing strategy matters more right now than it did six months ago. Sellers who overprice by 5% are going to sit, and sitting in a market with rising inventory creates its own set of conversations.
WHERE THE INVENTORY STANDS
At 5.1 months, the province is still below the long-run average of 6.4 months. That means technically it is still tilting toward sellers, but the gap is narrowing. For most buyers and sellers working in the Saint John market right now, the day-to-day feel has not materially changed from the past few months. Homes that are priced right and in desirable locations are still moving. Homes that are not are starting to accumulate days on market.
Rothesay and Quispamsis continue to see strong demand across most price ranges. RE/MAX also flagged a growing trend of buyers considering a move to Hampton, a data point worth watching if you work with clients who are flexible on location.

FROM THE FIELD
BATHROOM FANS VENTING INTO THE ATTIC
I flagged attic moisture or frost accumulation in nearly 40% of inspections this winter, with the pattern concentrated in homes built between 1985 and 2005 across Quispamsis and Rothesay. The cause is almost always the same: one or more bathroom exhaust fans dumping warm, humid air directly into the attic space instead of venting it through the roof or a gable wall to the outside.
Building codes have prohibited venting exhaust air into attics, crawl spaces, or any interior area of a building for decades. But many homes built before the mid-1990s were not held to the same enforcement standards, and even in newer homes, shortcuts during construction are common. The fan gets installed, the duct gets run into the attic, and nobody routes it the last few feet to the exterior.
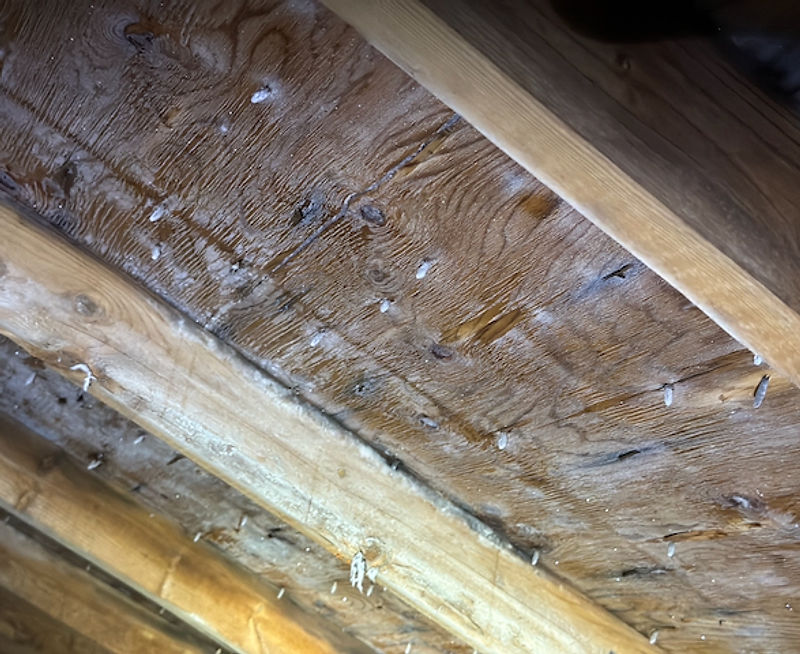
In a Maritime winter, the warm moist air from a hot shower hits the cold underside of the roof sheathing and condenses. If the temperature is low enough, it freezes. When it thaws, that moisture drips onto the insulation below, reducing its effectiveness and creating conditions for mould.
WHAT THE FIX LOOKS LIKE
A qualified contractor extends the existing duct through the roof or gable wall and adds a proper termination cap with a backdraft damper. In most cases it is a half-day job. The cost is typically under $500 per fan.
If your listing is a 1990s-era home in the KV, ask the seller whether the bathroom fans vent to the outside before you schedule listing photos. Addressing it proactively is a $300-500 conversation. Addressing it during a negotiation is a $3,000-5,000 conversation.
FROM THE FIELD
FOUNDATION CRACKS
AFTER FREEZE-THAW
March and April are when foundation cracks become most visible in Southern NB. The repeated freeze-thaw cycles expand existing hairline cracks into something noticeable, and water finding its way through those cracks leaves staining that buyers notice immediately. I documented new or worsened foundation cracking in 6 of my last 12 inspections on pre-1980 Saint John homes this winter.

Most of these cracks are structural hairline cracks that have been present for years, widened incrementally by seasonal movement. A vertical crack in a poured concrete wall, under 3mm wide, with no evidence of displacement or horizontal shifting, is common in homes of this vintage and typically not a structural concern. It is a maintenance item that can be sealed from the interior or exterior for a few hundred dollars.
But when a buyer sees a crack during an inspection, they do not see "common maintenance item." They see "foundation problem." And the word "foundation" changes the temperature of a negotiation fast.
If you are listing a pre-1980 home in Saint John this spring, consider booking a pre-listing inspection now, before the spring rush. A foundation crack that gets identified, documented, and addressed proactively costs a fraction of what it costs during a conditional period. More importantly, it removes the emotional leverage that a buyer gains when they see the word "foundation" in an inspection report for the first time.
SEASONAL SPOTLIGHT
1 in 4
NEW BRUNSWICK HOMES EXCEED HEALTH CANADA'S RADON GUIDELINE
THIS IS THE CONVERSATION YOUR CLIENTS ARE NOT HAVING. YET.
The 2024 Cross-Canada Radon Survey found that 1 in 4 New Brunswick homes have radon levels above Health Canada's guideline of 200 Bq/m3. That is more than double the national average. In some regions of the province, including parts of Southern NB, the number reaches 40%.
Last year, 100 homes in Grand Bay-Westfield were tested through a Health Canada-financed program called Take Action on Radon. Twenty-eight of those homes came back above safe levels. That is one service area town, and more than a quarter of the homes tested were over the guideline.
Radon is the leading cause of lung cancer in people who have never smoked, and the second leading cause overall after smoking. It is a naturally occurring radioactive gas that enters homes through foundation cracks, sump pumps, and any point where the building contacts the soil. You cannot see it, smell it, or taste it. The only way to know the level in a home is to test.
Radon awareness in New Brunswick is growing. Libraries across the province ran out of free test kits last fall after a CBC feature. Buyers are starting to ask about it, and you should be prepared with an answer.
WHAT THE TEST LOOKS LIKE
A certified measurement professional places a monitor in the lowest lived-in level of the home for a minimum of 90 days. Health Canada recommends testing during the fall and winter when airflow is lowest and radon levels are typically at their highest.
WHAT HAPPENS IF LEVELS ARE HIGH
A mitigation system creates a vacuum beneath the home's foundation and vents the gas outside. It can be installed in less than a day and reduces radon levels by more than 80% in most homes. The cost is typically $3,000 to $5,000, similar to replacing a furnace. Homes built in New Brunswick after 2015 may already have rough-in infrastructure in place, which reduces the cost significantly.
LISTING AGENT TIP

WHY PRE-LISTING INSPECTIONS MAKE MORE SENSE IN A SHIFTING MARKET
When inventory was tight and homes were selling in multiple offers with waived conditions, a pre-listing inspection was a nice-to-have. In a market where inventory is building and buyers have more options, it becomes a competitive advantage.
Here is the math. A standard inspection takes 2.5 to 4 hours and costs the same whether the buyer or seller orders it. The difference is timing and control. When the buyer orders the inspection, the findings land during the conditional period, the most vulnerable point of the transaction. When the seller orders the inspection before listing, the findings are known, addressed or disclosed, and the conditional period becomes a formality.
Agents who are recommending pre-listing inspections right now are seeing three benefits: they eliminate the surprise factor that kills deals, they shorten the conditional period, and they give the seller a documented record of the home's condition that builds buyer confidence.
I offer the same thorough inspection at the same price regardless of who books it. The report is delivered within 24 hours. If you have a listing coming up this spring, reach out any time.
"Jonathan was incredibly thorough and professional. He took the time to walk us through every finding and made sure we understood what was important versus what was cosmetic. I recommend him to all my clients without hesitation."
VERIFIED GOOGLE REVIEW
4.9
550+ GOOGLE REVIEWS
Southern NB's Most Reviewed Inspector
RELATED READS
EAST COAST HOME INSPECTION LTD
RHI • WETT • C-NRPP • 2,000+ INSPECTIONS
Hampton, New Brunswick | Serving Saint John & Southern NB
theinspectors.ca
© 2026 East Coast Home Inspection Ltd. All rights reserved.
